Stories from Rijpfjorden 4: On mine kibbles, sea ice and food chains
Sea ice and snow reflect and absorb effectively up to 99% of all light, which in turn helps regulate the start and length of the algal bloom in the ocean below. This usually results in short and intense blooms when the sea ice melts.
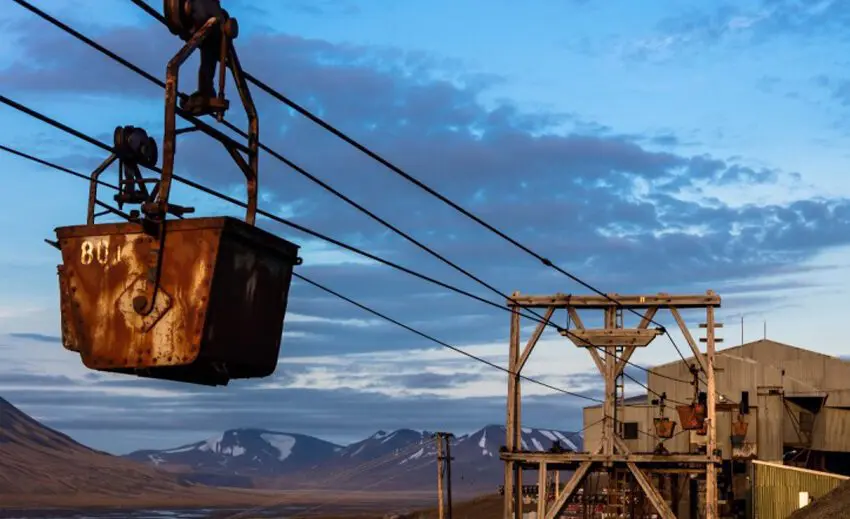
A mine kibble (cargo box) hangs on the old aerial tramway above Longyearbyen. Although each kibble did not transport much coal, the number and frequency of the kibble system transported large amounts of coal in total. Photo: Børge Damsgård
Text: Professor Jørgen Berge (UiT The Arctic University of Norway, UNIS and NTNU), Associate professor Janne Søreide (UNIS), Researcher Malin Daase (UiT The Arctic University of Norway), Professor Paul Renaud (Akvaplan-niva and UNIS) and Professor Stig Falk-Petersen (Akvaplan-niva and UiT The Arctic University of Norway).
Arctic species show adaptations to such a production regime, usually because they are able to eat and put on a lot of weight in the short periods where there is food access, and then live on this stored fat in meager times. The Calanus glacialis is a good example of this. But what’s that got to do with the kibble used for coal transportation in Longyearbyen in the past?
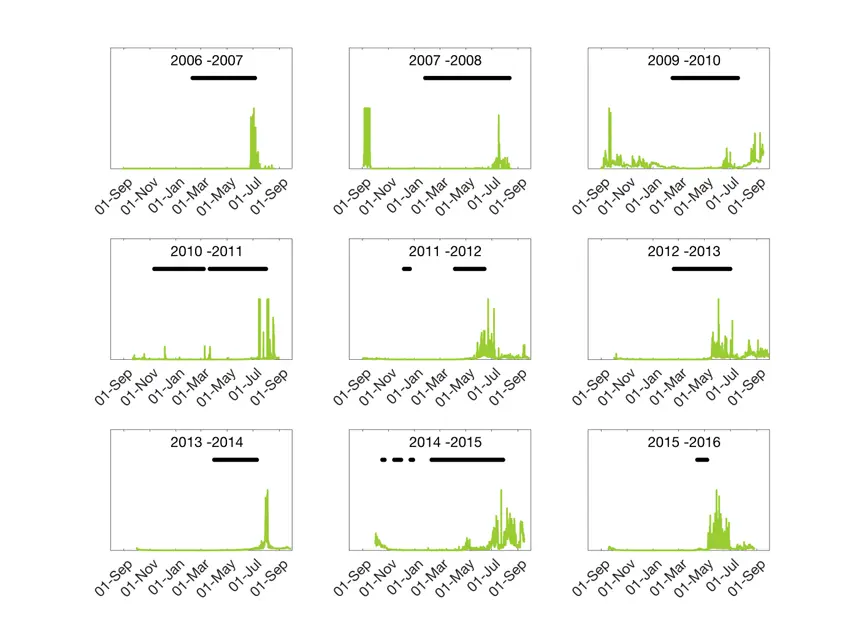
Sea ice extent in the Polar Ocean is most often measured by satellite. In recent weeks we have seen ice maps that indicate that the sea ice extent in the European part of the Arctic is at a record low this year. In the fjords, on the other hand, it is often difficult to use satellite measurements – the resolution simply is not high enough to provide good information. As part of the measurements we have made with the ocean observatory in Rijpfjorden, we have detected the presence of ice. This is done using an acoustic instrument that is actually designed to measure currents, but as a by-product we also get information if there is sea ice just above the instrument. The instrument does not say anything about the thickness of the ice, only if there is ice or not at one point right above the instrument. It also does not detect new and slushy sea ice, so we underestimate the time period of the ice extent with about two weeks in the beginning of winter. At the same time we measure the amount of chlorophyll in the water; a measurement of the extent of the algae bloom (see facts at the bottom of this article).
Over time, we have seen that the sea ice extent in Rijpfjorden has declined. There is no clear statistical connection, but there is a trend towards shorter and more cracked ice cover. This has also affected the algae bloom in the fjord. In the first few years we saw a very short blooming period, something we would designate as a typical Arctic bloom. This year we have observed a longer blooming period with short or varying ice cover.
A shift in system – or maybe not?
Classic polar biology indicates that this will lead to a shift from a system dominated by the Arctic Calanus glacialis to a system dominated by the Calanus finmarchicus. Since Calanus finmarchicus is smaller in size and less nutritious, a classic understanding has meant that this will have dramatic consequences for the rest of the food chain. For it seems quite logical to think that when we go from a system dominated by the relatively large and nutritious Calanus glacialis to a system dominated by the smaller and less nutritious Calanus finmarchicus, this will cause the predators feeding on Calanus glacialis to suddenly to deal with something that is smaller and that provides less nutrition. Nutrition that is badly needed for offspring production or for the animals’ own fat storages that shall last throughout the winter. But maybe this is not necessarily true?
Because even though the Calanus finmarchicus is smaller than the Calanus glacialis, and although it is true that in terms of nutritional content size do matter, it’s not necessarily true that the total food supply is reduced.
And this is where the kibble (cargo box) used for coal transportation comes into the picture. Just think of how they once ran along long stretches on the aerial tramway between the mine and the coal storage location. The authors of this chronicle (with one exception…) are not old enough to have witnessed this, but it’s easy to imagine how it used to be, when seeing the old kibbles around Longyearbyen. But the size of the kibble is not particularly impressive – why were they not bigger? Even though the answer to this obviously also has a practical aspect that we here will ignore, it is the frequency of the kibble transportation that is the key element. Due to the fact that there were enough kibbles on the aerial tramway, and because the aerial tramway went fast enough, large quantities of coal were transported despite the size of the kibble.
This is most likely the case with the Calanus glacialis and the Calanus finmarchicus too. Even though the Calanus glacialis is bigger than Calanus finmarchicus and therefore provides more energy to its predators, the total energy production can actually be higher in a system dominated by Calanus finmarchicus. It has a shorter lifespan, shorter generation span, and is thus able to contribute more energy per year into the system than the bigger Calanus glacialis.
And our models support this view. Even though we are going to see a change from a more Calanus glacialis dominated system to a more Calanus finmarchicus dominated system in our areas of the Arctic, this can actually have the opposite effect than we previously believed. This is obviously good news for anyone who is happy that the big whales now appear to be more and more common around Svalbard, as there now seem to be more food for everyone. And the kibble that hangs around Longyearbyen is a good illustration of why it can be so!
Facts:
Measurements of the amount of chlorophyll are done by means of an optical instrument (fluorometer). The instrument emits a beam of light with a certain wavelength. When this light beam hits a chloroplast (part of an algae cell where photosynthesis occurs), the chloroplast will absorb the light while sending out light at another given wavelength. It is measurements of this radiation that quantify the amount of chlorophyll found in the water.
But there are two important limitations/problems with such measurements that we must always take into account:
- The measurements are made at a given depth (where the instrument is deployed). On our rigs this depth can vary from year to year, which means that the intensity of bloom cannot be compared between years. Therefore, we can only use our measurements to compare how long the bloom lasts year to year (not the amount of chlorophyll).
- As the measurements are made optically, the sensor is sensitive to particles entering the light beam. Therefore, on an instrument that is deployed for a whole year, this may produce a major source of error considering the amount of chlorophyll registered. For example, the years 2007–8 and 2009–10 showed a big bloom late in the autumn right after the instrument was deployed. This is most likely a result of amphipods using the instrument as a hideaway from predators. After we put netting over the instrument sensor in autumn 2010, we have not seen such “blooms” in Rijpfjorden in the autumn…